FHR Halal Dividend 30
The 30 largest Shariah-compliant companies among the constituents of the Dow Jones U.S. Dividend 100 Index, weighted by float-adjusted market value with at most 4% per company and 25% per sector, reweighted quarterly.
Back-tested, gross of fees, 2012-03-16 to 2026-09-23.
Rules
| Universe | constituents of the Dow Jones U.S. Dividend 100 Index at each March reconstitution (10 years of dividends, size and liquidity screens, the higher-yielding half, then a quality score: cash flow to debt, return on equity, yield, 5-year dividend growth) |
| Shariah screen | AAOIFI Shariah Standard 21 ratios (interest-bearing debt and cash at most 30% of 36-month average market value, non-permitted income at most 5% of revenue), excluded industries and activity reviews, as in the methodology |
| Selection | the 30 largest remaining companies by float-adjusted market value (all of them if fewer than 30) |
| Weighting | float-adjusted market value, at most 4% per company and 25% per sector; a daily check resets the weights when companies above 4.7% exceed 22% together |
| Rebalancing | after the third Friday of March, June, September and December |
| Paper record | a separate paper account bought the 30 constituents at the 6 November 2026 open |
| Comparisons | SCHD (the fund that tracks the parent index) and SPUS |
Live record
A separate paper account of US$1,000,000 bought the constituents at the open of 6 November 2026. Live figures appear here after the first full trading day, and are never mixed with the back-test.
Back-tested performance
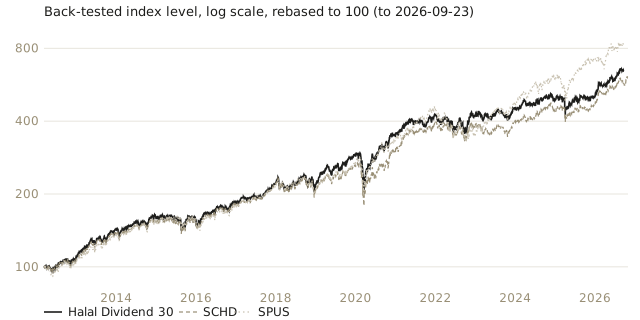
Hypothetical. Annualised total return, dividends reinvested, 2012-03-16 to 2026-09-23. Index lines are gross of fees and withholding tax; SPUS, SCHD and SPMO are funds and are shown net of their fees (0.06% to 0.45% a year). The comparison therefore flatters the index by up to about half a point a year.
| Since start | 5 years | 10 years | Max drawdown | |
|---|---|---|---|---|
| Halal Dividend 30 (back-tested) | 13.7% | 10.9% | 13.9% | -33% |
| SCHD | 13.2% | 10.2% | 13.8% | -33% |
| SPUS | 15.8% | 15.4% | 17.4% | -31% |
Risk
Monthly returns, 2012-03-16 to 2026-09-23. Definitions on the backtest page.
| Volatility | Sharpe | Sortino | Calmar | Longest drawdown | Best month | Worst month | Months up | |
|---|---|---|---|---|---|---|---|---|
| Halal Dividend 30 (back-tested) | 14.0% | 0.87 | 1.45 | 0.42 | 15 months | 13.9% | -11.4% | 64% |
| SCHD | 13.7% | 0.82 | 1.35 | 0.40 | 23 months | 13.2% | -11.9% | 64% |
| SPUS | 14.7% | 0.97 | 1.60 | 0.51 | 23 months | 13.0% | -9.1% | 69% |
Against SCHD
Over the months both lines cover. No statistically significant difference: the information ratio is small and its t-statistic is under 1.
| Beta | Alpha a year | Correlation | Tracking error | Information ratio | Up capture | Down capture | |
|---|---|---|---|---|---|---|---|
| Halal Dividend 30 (back-tested) | 0.99 | 1.0% | 0.97 | 3.6% | 0.23 | 101% | 96% |
| SPUS | 0.80 | 5.1% | 0.75 | 10.1% | 0.28 | 97% | 80% |
Halal Dividend 30 by period
Back-tested, to 2026-09-23.
| Per year | Volatility | Sharpe | Sortino | Max drawdown | |
|---|---|---|---|---|---|
| 3 years | 14.8% | 13.1% | 0.82 | 1.38 | -18% |
| 5 years | 10.9% | 15.5% | 0.53 | 0.89 | -18% |
| 10 years | 13.9% | 15.6% | 0.75 | 1.24 | -33% |
| Since start | 13.7% | 14.0% | 0.87 | 1.45 | -33% |
Calendar years
| 2017 | 2018 | 2019 | 2020 | 2021 | 2022 | 2023 | 2024 | 2025 | 2026 YTD | |
|---|---|---|---|---|---|---|---|---|---|---|
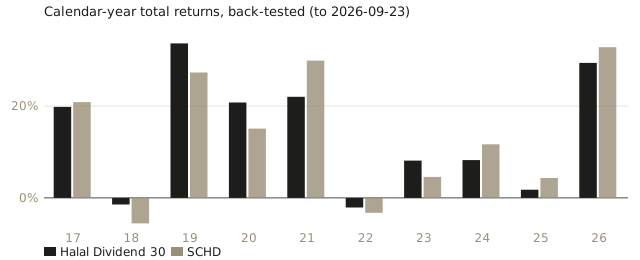
| Halal Dividend 30 | 19.8% | -1.4% | 33.6% | 20.8% | 22.0% | -2.1% | 8.1% | 8.2% | 1.8% | 29.4% |
| SCHD | 20.8% | -5.6% | 27.3% | 15.1% | 29.9% | -3.2% | 4.6% | 11.7% | 4.3% | 32.8% |
How the back-test was checked
Members come from SCHD's own SEC filings (2011 to 2026). The index's maintenance rules were rebuilt as published: reconstitution after the third Friday of March with index shares set on prices twelve business days earlier, quarterly reweights on prices of the Wednesday before the first Friday, the daily 4.7% / 22% cap check two days later outside the freeze periods, and removals between reconstitutions. Float-adjusted values come from S&P's own float in the holdings of the S&P 1500 index funds, otherwise from each company's 10-K cover page. Without the screen, the rebuild tracks the official Dow Jones U.S. Dividend 100 price index within 0.46% a year (tracking error, 2016 to 2026). Two alternatives were tested and rejected: refilling the screened places from the next-ranked eligible companies, and running the whole selection on a screened universe. Both earned about 1.5 points a year less.
Constituents
Index weights as of the 2026-09-18 reweighting.
| Symbol | Company | Weight |
|---|---|---|
| MRK | Merck & Co., Inc. | 4.00% |
| PG | Procter & Gamble Company | 4.00% |
| KO | Coca-Cola Company | 4.00% |
| HD | Home Depot, Inc. | 4.00% |
| TXN | Texas Instruments Incorporated | 4.00% |
| ABT | Abbott Laboratories | 4.00% |
| PEP | PepsiCo, Inc. | 4.00% |
| QCOM | QUALCOMM Incorporated | 4.00% |
| ACN | Accenture PLC | 4.00% |
| KMB | Kimberly-Clark Corporation | 4.00% |
| HSY | The Hershey Company | 4.00% |
| CVX | Chevron Corporation | 3.98% |
| COP | ConocoPhillips | 3.98% |
| SLB | SLB Limited | 3.98% |
| EOG | EOG Resources, Inc. | 3.98% |
| DVN | Devon Energy Corporation | 3.98% |
| ADP | Automatic Data Processing, Inc. | 3.88% |
| UPS | United Parcel Service, Inc. | 3.88% |
| FAST | Fastenal Company | 3.88% |
| PAYX | Paychex, Inc. | 3.88% |
| BR | Broadridge Financial Solutions, Inc. | 2.99% |
| SNA | Snap-on Incorporated | 2.87% |
| BBY | Best Buy Company, Inc. | 2.82% |
| DINO | HF Sinclair Corporation | 2.58% |
| APA | APA Corporation | 2.51% |
| SWKS | Skyworks Solutions, Inc. | 1.79% |
| WSO | Watsco, Inc. | 1.58% |
| ALV | Autoliv, Inc. | 1.39% |
| BAH | Booz Allen Hamilton Holding Corporation | 1.29% |
| MSM | MSC Industrial Direct Co., Inc. | 0.78% |
Sector weights
| Sector | Weight |
|---|---|
| Energy | 25.0% |
| Information Technology | 21.5% |
| Consumer Staples | 20.0% |
| Industrials | 17.2% |
| Consumer Discretionary | 8.2% |
| Health Care | 8.0% |