FHR Halal Momentum 100
About 100 Shariah-compliant S&P 500 companies with the strongest risk-adjusted 12-month momentum, ranked on the whole S&P 500, weighted by float-adjusted market value times momentum score, at most 9% per company, rebalanced in March and September.
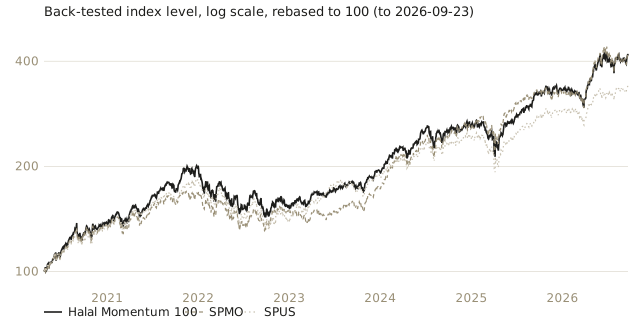
Back-tested, gross of fees, 2020-04-24 to 2026-09-23.
Rules
| Universe | the S&P 500, every share line, as it stood on each reference date (last business day of February and August) |
| Momentum | price change with dividends over 12 months, ending one month before the reference date, divided by the volatility of daily returns over the same period; z-score across the S&P 500, capped at plus or minus 3; score 1 + z (or 1 / (1 - z) when negative) |
| Shariah screen | AAOIFI Shariah Standard 21 ratios (interest-bearing debt and cash at most 30% of 36-month average market value, non-permitted income at most 5% of revenue), excluded industries, and activity reviews decided by two independent screeners, as in the methodology |
| Selection | the S&P 500 ranked by momentum score; Shariah-compliant lines kept in rank order until the target count (one fifth of the S&P 500's companies, about 100) is reached, with a buffer: the top 80% enter, current constituents within the top 120% stay |
| Weighting | float-adjusted market value times momentum score, at most 9% per company and three times the company's market-value weight among the constituents |
| Rebalancing | after the close of the third Friday of March and September, with weights set on reference-date prices |
| Paper record | a separate paper account bought the constituents at the 6 November 2026 open |
| Comparisons | SPMO (the fund that tracks the S&P 500 Momentum Index) and SPUS |
Live record
A separate paper account of US$1,000,000 bought the constituents at the open of 6 November 2026. Live figures appear here after the first full trading day, and are never mixed with the back-test.
How the rebuild was checked
The rules were first rebuilt without the Shariah screen and checked against the official S&P 500 Momentum Index levels, daily, from 2020-04-24 to 2026-09-23: tracking error 0.28% a year, return gap -0.05 pt a year. That is the floor of the data used: the fund's own reported holdings, run through the same prices, give the same figure. Membership, buffer, weights and caps were checked against SPMO's holdings at every rebalance. The Shariah version then changes only which lines may be held.
Back-tested performance
Hypothetical. Annualised total return, dividends reinvested, 2020-04-24 to 2026-09-23. Index lines are gross of fees and withholding tax; SPUS, SCHD and SPMO are funds and are shown net of their fees (0.06% to 0.45% a year). The comparison therefore flatters the index by up to about half a point a year.
| Since start | 5 years | Max drawdown | |
|---|---|---|---|
| Halal Momentum 100 (back-tested) | 24.9% | 18.5% | -29% |
| SPMO | 24.8% | 20.6% | -23% |
| SPUS | 20.8% | 15.4% | -28% |
Risk
Monthly returns, 2020-04-24 to 2026-09-23. Definitions on the backtest page.
| Volatility | Sharpe | Sortino | Calmar | Longest drawdown | Best month | Worst month | Months up | |
|---|---|---|---|---|---|---|---|---|
| Halal Momentum 100 (back-tested) | 19.0% | 1.11 | 2.01 | 0.86 | 2.1 years | 17.7% | -10.9% | 68% |
| SPMO | 19.4% | 1.09 | 2.09 | 1.09 | 23 months | 19.3% | -11.0% | 64% |
| SPUS | 17.0% | 1.02 | 1.74 | 0.74 | 23 months | 11.7% | -9.1% | 64% |
Against SPMO
No statistically significant difference: the screen keeps the momentum return without improving it.
| Beta | Alpha a year | Correlation | Tracking error | Information ratio | Up capture | Down capture | |
|---|---|---|---|---|---|---|---|
| Halal Momentum 100 (back-tested) | 0.91 | 1.7% | 0.93 | 7.0% | -0.01 | 98% | 98% |
| SPUS | 0.73 | 1.9% | 0.83 | 10.8% | -0.35 | 79% | 86% |
Halal Momentum 100 by period
Back-tested, to 2026-09-23.
| Per year | Volatility | Sharpe | Sortino | Max drawdown | |
|---|---|---|---|---|---|
| 3 years | 33.3% | 18.2% | 1.46 | 3.20 | -21% |
| 5 years | 18.5% | 19.9% | 0.83 | 1.44 | -29% |
| Since start | 24.9% | 19.0% | 1.11 | 2.01 | -29% |
Constituents
Index weights as of the 2026-09-18 rebalance.
| Symbol | Company | Weight |
|---|---|---|
| MU | Micron Technology, Inc. | 9.00% |
| AAPL | Apple Inc. | 9.00% |
| GOOGL | Alphabet Inc. | 5.00% |
| AVGO | Broadcom Inc. | 4.97% |
| JNJ | Johnson & Johnson | 4.68% |
| AMD | Advanced Micro Devices, Inc. | 4.45% |
| INTC | Intel Corporation | 4.05% |
| GOOG | Alphabet, Inc. (Class C) | 4.00% |
| LLY | Eli Lilly & Co. | 3.83% |
| XOM | ExxonMobil Holdings Corporation | 3.12% |
| LRCX | Lam Research Corporation | 2.83% |
| AMAT | Applied Materials, Inc. | 2.56% |
| CSCO | Cisco Systems, Inc. Common Stock (DE) | 2.43% |
| MRK | Merck & Co., Inc. | 2.27% |
| STX | Seagate Technology Holdings PLC Ordinary Shares (Ireland) | 2.07% |
| CAT | Caterpillar Inc. | 2.04% |
| ABBV | ABBVIE INC. | 1.85% |
| WDC | Western Digital Corporation | 1.73% |
| PANW | Palo Alto Networks, Inc. | 1.72% |
| CVX | Chevron Corporation | 1.67% |
| KO | Coca-Cola Company | 1.61% |
| KLAC | KLA Corporation | 1.11% |
| CRWD | CrowdStrike Holdings, Inc. | 0.96% |
| TXN | Texas Instruments Incorporated | 0.94% |
| VLO | Valero Energy Corp. | 0.87% |
| ADI | Analog Devices, Inc. | 0.86% |
| WELL | Welltower, Inc. | 0.85% |
| LITE | Lumentum Holdings Inc. | 0.79% |
| UNP | Union Pacific Corp. | 0.77% |
| APH | Amphenol Corp. | 0.71% |
| ANET | Arista Networks, Inc. | 0.61% |
| TJX | TJX Cos., Inc. (The) | 0.61% |
| GLW | Corning, Inc. | 0.55% |
| COP | ConocoPhillips | 0.55% |
| ROST | Ross Stores, Inc. | 0.55% |
| GILD | Gilead Sciences, Inc. | 0.51% |
| CIEN | Ciena Corp. | 0.49% |
| PH | Parker-Hannifin Corp. | 0.49% |
| NEM | Newmont Corp. | 0.48% |
| CSX | CSX Corporation | 0.46% |
| FTNT | Fortinet, Inc. | 0.43% |
| EQIX | Equinix, Inc. | 0.41% |
| CMI | Cummins Inc. | 0.41% |
| TER | Teradyne, Inc. | 0.41% |
| FCX | Freeport-McMoRan, Inc. | 0.40% |
| MNST | Monster Beverage Corporation | 0.39% |
| PWR | Quanta Services, Inc. | 0.39% |
| SLB | SLB Limited | 0.37% |
| NUE | Nucor Corporation | 0.36% |
| JCI | Johnson Controls International plc | 0.35% |
| FIX | Comfort Systems USA, Inc. | 0.34% |
| VRT | Vertiv Holdings Co. | 0.34% |
| MCK | McKesson Corp. | 0.32% |
| MPWR | Monolithic Power Systems, Inc. | 0.31% |
| KEYS | Keysight Technologies, Inc. | 0.30% |
| REGN | Regeneron Pharmaceuticals, Inc. | 0.30% |
| NSC | Norfolk Southern Corp. | 0.28% |
| EOG | EOG Resources, Inc. | 0.26% |
| UPS | United Parcel Service, Inc. | 0.26% |
| COHR | Coherent Corp. | 0.26% |
| WAB | Westinghouse Air Brake Technologies Corp. | 0.25% |
| CAH | Cardinal Health, Inc. | 0.25% |
| DAL | Delta Air Lines, Inc. | 0.23% |
| GWW | W.W. Grainger, Inc. | 0.22% |
| AME | AMETEK, Inc. | 0.22% |
| O | Realty Income Corp. | 0.22% |
| STLD | Steel Dynamics, Inc. | 0.21% |
| DVN | Devon Energy Corporation | 0.20% |
| ROK | Rockwell Automation, Inc. | 0.18% |
| NTAP | NetApp, Inc. | 0.17% |
| PSA | Public Storage | 0.17% |
| GRMN | Garmin Ltd. | 0.16% |
| FANG | Diamondback Energy, Inc. | 0.15% |
| CASY | Casey's General Stores, Inc. | 0.15% |
| BIIB | Biogen, Inc. | 0.14% |
| OXY | Occidental Petroleum Corp. | 0.14% |
| EBAY | eBay, Inc. | 0.13% |
| ODFL | Old Dominion Freight Line, Inc. | 0.13% |
| HAL | Halliburton Co. | 0.12% |
| JBHT | J.B. Hunt Transport Services, Inc. | 0.11% |
| EXPD | Expeditors International of Washington, Inc. | 0.11% |
| JBL | Jabil, Inc. | 0.10% |
| INCY | Incyte Corp. | 0.10% |
| WST | West Pharmaceutical Services, Inc. | 0.09% |
| EME | EMCOR Group, Inc. | 0.09% |
| DD | DuPont de Nemours, Inc. | 0.09% |
| TPR | Tapestry, Inc. | 0.09% |
| SNA | Snap-on Incorporated | 0.09% |
| NDSN | Nordson Corporation | 0.08% |
| APA | APA Corporation | 0.08% |
| IEX | IDEX Corp. | 0.08% |
| TDY | Teledyne Technologies, Inc. | 0.08% |
| PKG | Packaging Corp. of America | 0.07% |
| CF | CF Industries Holdings, Inc. | 0.06% |
| ALB | Albemarle Corporation | 0.06% |
| FTV | Fortive Corp. | 0.06% |
| BBY | Best Buy Company, Inc. | 0.05% |
| FSLR | First Solar, Inc. | 0.05% |
| CHRW | C.H. Robinson Worldwide, Inc. | 0.05% |
| RL | Ralph Lauren Corp. | 0.04% |
Sector weights
| Sector | Weight |
|---|---|
| Information Technology | 54.0% |
| Health Care | 14.3% |
| Communication Services | 9.0% |
| Industrials | 8.0% |
| Energy | 7.5% |
| Consumer Staples | 2.0% |
| Consumer Discretionary | 1.8% |
| Materials | 1.7% |
| Real Estate | 1.6% |